Changelog 27 (12/22)
Grafana support
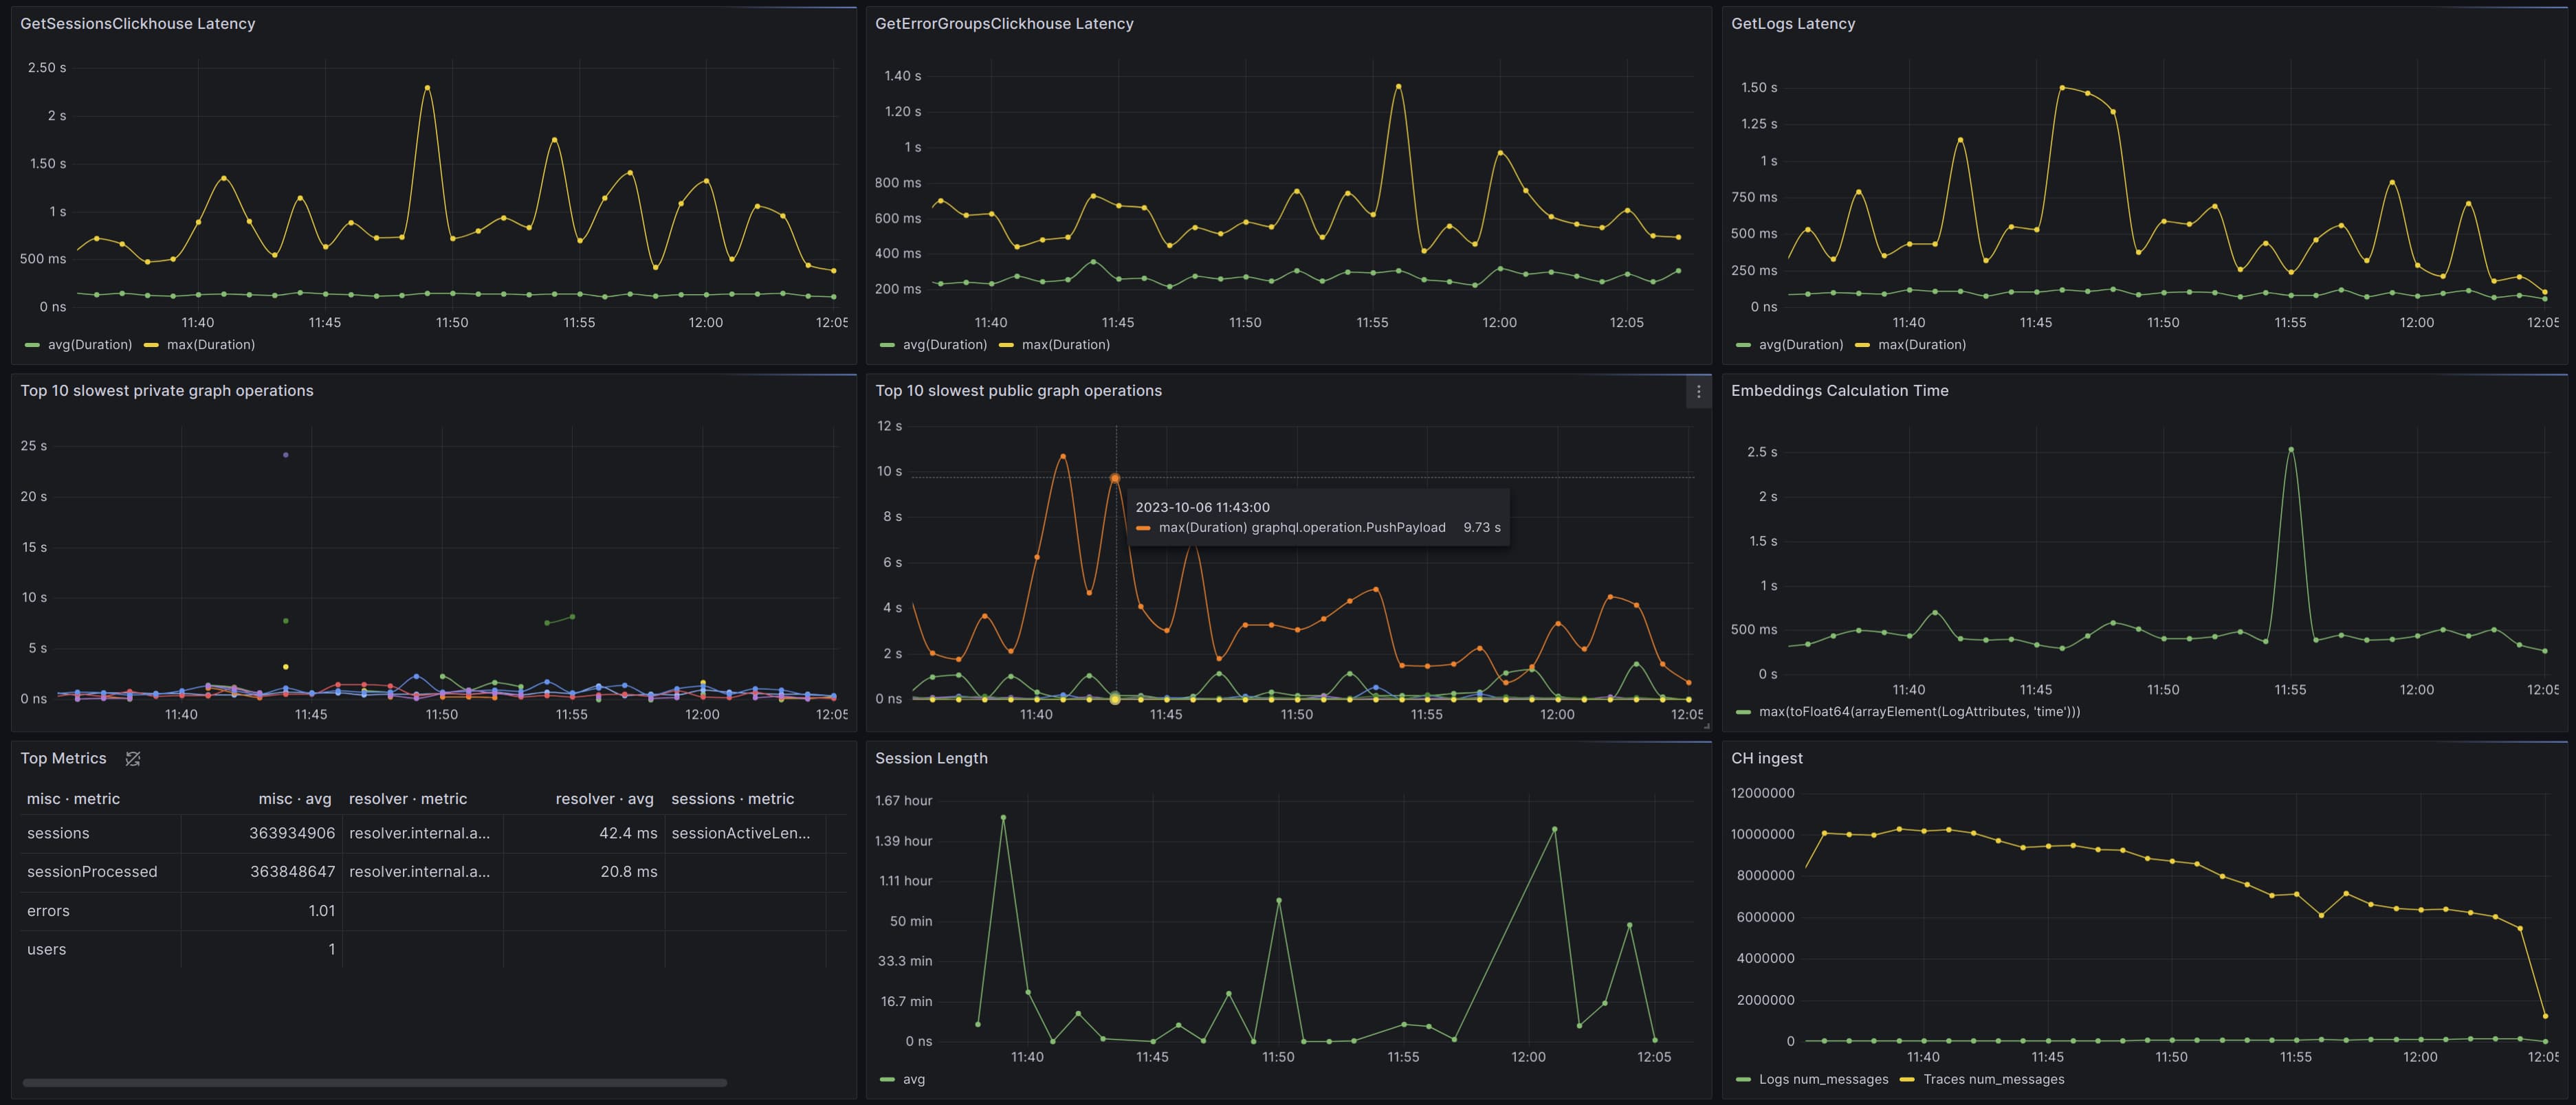
We support integrating with Grafana to visualize metrics from your applications frontend and backend. Track network request latency, application errors, and backend traces all in one place. You'll get customization into aggregate query types (p50, p99, etc.) for performance and availability metrics automatically captured from our SDKs, with the ability to report custom metrics and traces as well.
Check our Grafana documentation for all of the details

Graduated pricing
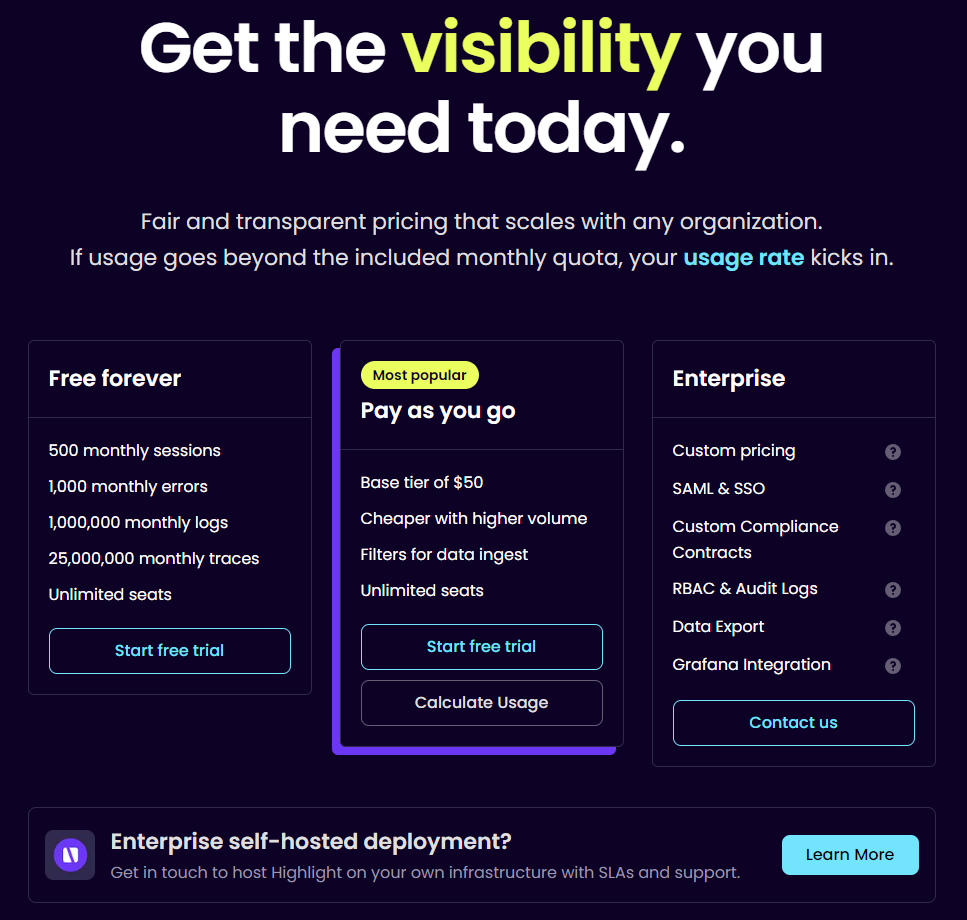
Pay-as-you-go pricing now has a $50 base tier and decreases in price as volume increases.

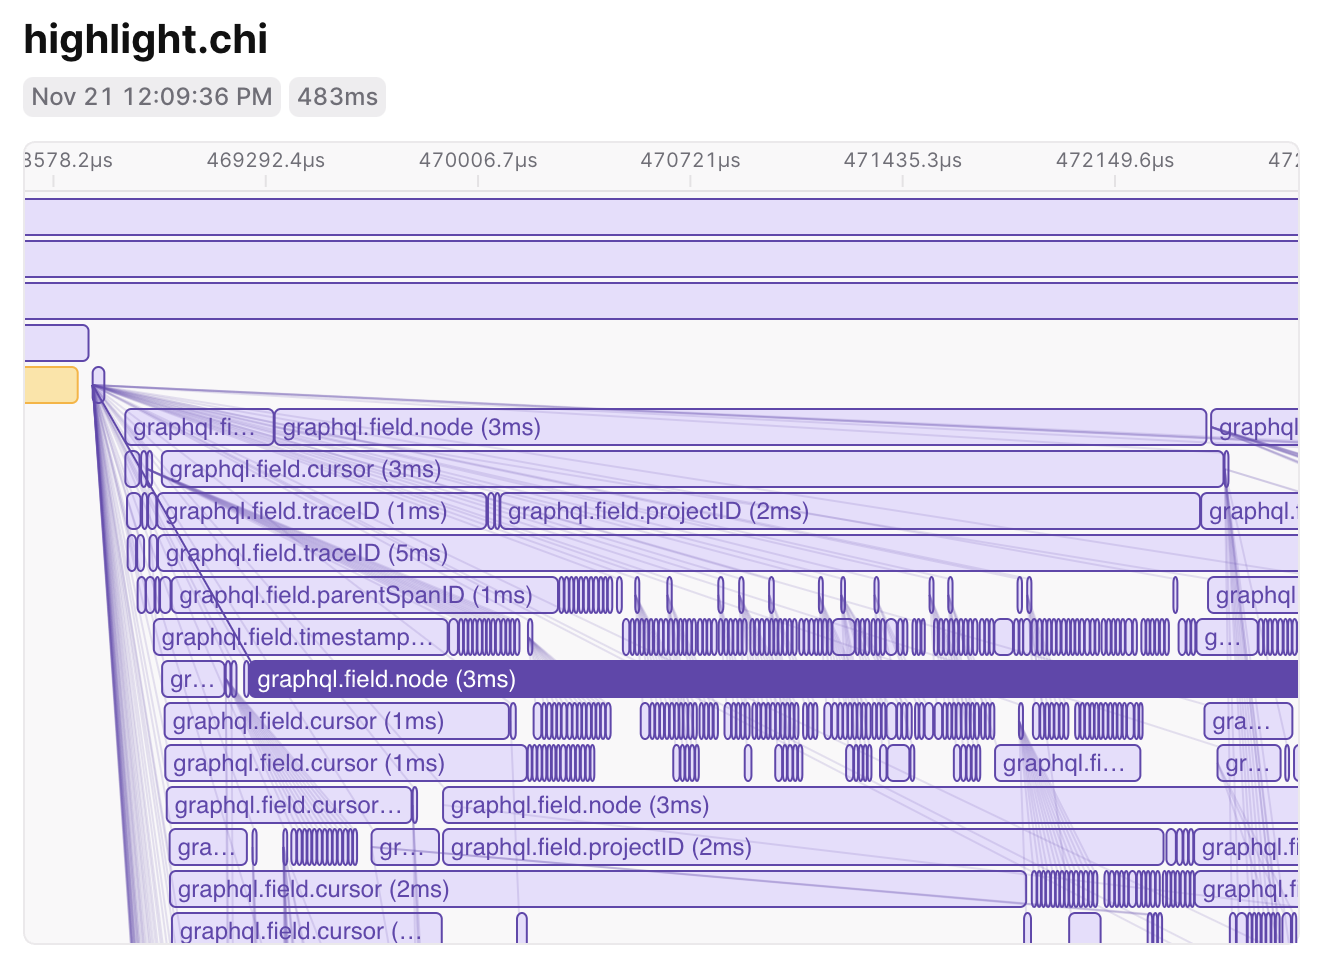
Tracing flame graph visual improvements
We're continuing to improve our Tracing Beta.
Dense flame graphs can be difficult to visualize, so we've spread them out vertically to make them more comprehensible.

Pass environment data through our server-side SDKs
You'll get more detail about the environment in which your server-side errors are thrown.
This is entirely automatic. Our SDKs can now export environment data from your servers directly to your Highlight reports.