Fullstack Mapping
What's this?
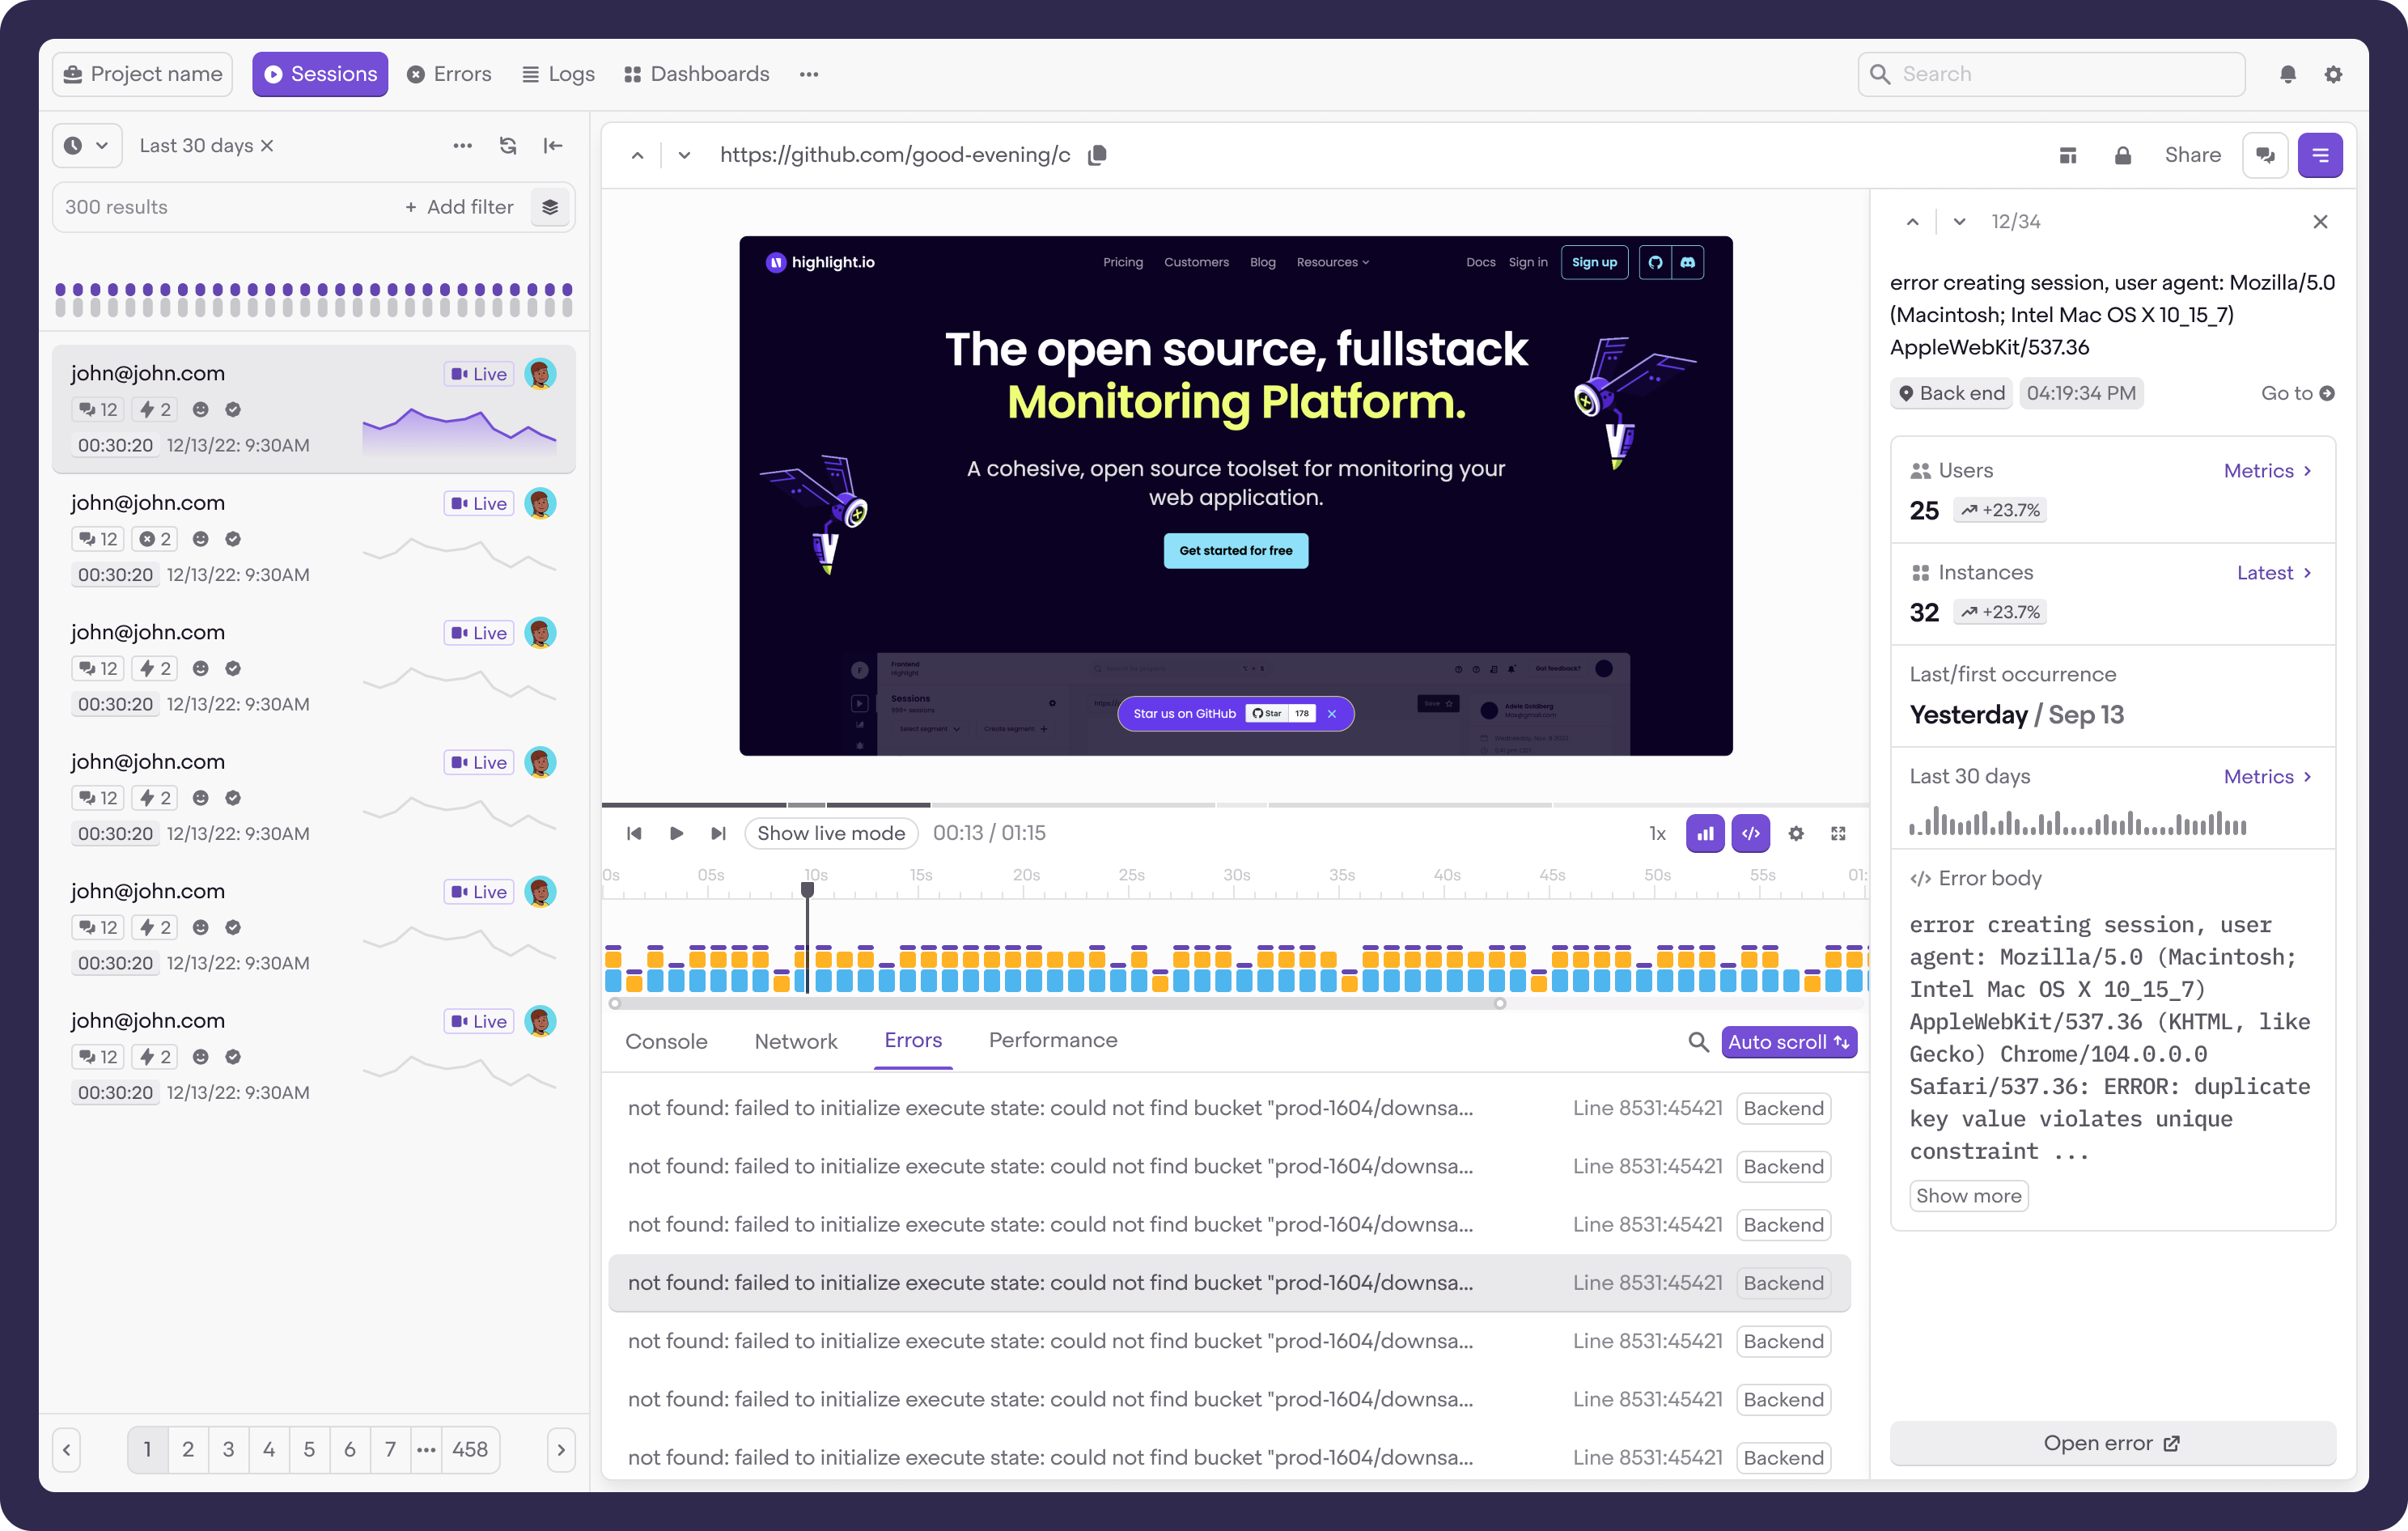
In order to make the most out of highlight.io, we suggest instrumenting your frontend and backend so that you can attribute frontend requests with backend errors and logs. See an example below, where you can view an error's details alongside frontend session replay, allowing you to get the full context you need.

Below, we detail the requirements to get this working as well as how to troubleshoot.
How can I start using this?
Install the client bundle
If you haven't already, you need to install our client javascript bundle in the framework of your choice. Get started below:
Turn on tracingOrigins
Set the tracingOrigins option to an array of patterns matching the location of your backend. You may also simply specify true, which will default tracingOrigins to all subdomains/domains of the url for your frontend app.
H.init("<YOUR_PROJECT_ID>", {
	tracingOrigins: ['localhost', 'example.myapp.com/backend'],
    ...
});
Turn on networkRecording
H.init("<YOUR_PROJECT_ID>", {
	networkRecording: {
		enabled: true,
		recordHeadersAndBody: true,
	},
	...
});
Backend Changes
Backend changes are dependent on the underlying language/framework used on the server-side codebase. All you need to add is a middleware and code to capture errors.
Below are solutions for what we support today. If you'd like us to support a new framework, feel free to shoot us a message at support@highlight.io or drop us a note in our discord.
Distributed Tracing
Your backend might be a distributed system with multiple services. Say, for example, a frontend Next.js application with a Next.js backend ,which makes HTTP requests to a Python FastAPI microservice. In a case like that, you may want errors and logs from your Python service to be attributed to the frontend sessions in Highlight.
Our frontend -> backend tracing uses the x-highlight-request HTTP header to attribute frontend requests with backend errors and logs. So, in the case of the example above, assuming all of your services have the highlight sdk installed, if your Next.js backend performs an HTTP request to a FastAPI backend and you forward the x-highlight-request header along, the trace will carry over information about the frontend session.
await fetch('my-fastapi-backend:8000/api', { headers: {'x-highlight-request': request.headers.get(`x-highlight-request`)} })
A more complex application might not make HTTP requests between backend services, however. Instead, it may
use a message broker like Kafka to queue up jobs. In that case, you'll need to add a way to
store the x-highlight-request you receive from the frontend along with your enqueued messages.
The service that consumes the messages can then pass the value to the highlight SDK via custom
error wrapping or logging code as per usual.
// the receiving example references `request.headers`, but this could be read from another service-to-service protocol (ie. gRPC, Apache Kafka message)
const parsed = H.parseHeaders(request.headers)
H.consumeError(error, parsed.secureSessionId, parsed.requestId)
Troubleshooting
-
Ensure
tracingOriginsandnetworkRecordingare properly set.
-
Ensure your backend has
CORSconfigured for your frontend hostname, explicitly allowing headerx-highlight-request.
-
For debugging the backend SDK of your choice, in order to debug, we suggest enabling verbose logging. For example, in Go, add
highlight.SetDebugMode(myLogger)
-
If all else fails, please email us at support@highlight.io or join the #support channel on our discord.